이 프로젝트는 아모레퍼시픽 크리에이티브 센터의 선행디자인 프로그램인 Creative Partners 를 통해 제안한 아이디어에서 시작되었습니다.
Proposal for Emotion-Based Customer Research Methods
감정 기반의 고객 조사 방법 제안
AMOREPACIFICMay 12, 2023
Using wearable devices that measure vital signs, we can interpret a person’s biodata in minutes to
read their emotional state. We initiated a creative project to explore how this technology could
be utilized in customer research. Our goal was to design an experience that would allow us to
measure customer emotions in real-time and, in return, provide them with unique insights and rewards.
Image source : https://www.upmood.com/
First, we needed to test how the technology worked and what kind of results it could deliver to customers.
We decided to use our team’s ‘Story A’ exhibition space for the tests. We conducted two separate trials:
one during the B.READY exhibition and another during the Happy Bath exhibition.
The B.READY exhibition, which ran for a month starting in July 2025, was based on the concept of “Your Exciting Moment.” The space was designed with six distinct spots, each offering a unique experience. Rather than just letting visitors pass through, our goal was to quickly test and understand which spots made them feel the most excited, and why.
Before the test, we established a few parameters. Since the technology required at least one minute of data to measure emotion, we needed to ensure visitors dwelled at each spot. We designed the experience to encourage a stay of at least one minute per spot, during which we analyzed their emotional state and stress levels. Afterward, we compared our data on their “most exciting moment” with their self-reported experience. If the results matched, we offered special insights and rewards.
We recruited a limited number of participants through the Story A social media channels.
After they went through the exhibition, Dr. Kwon Goo-sang, our collaborator on this project,
provided them with feedback on their results. The sessions lasted about 10 minutes each,
and the participants’ reactions were generally positive and full of curiosity.
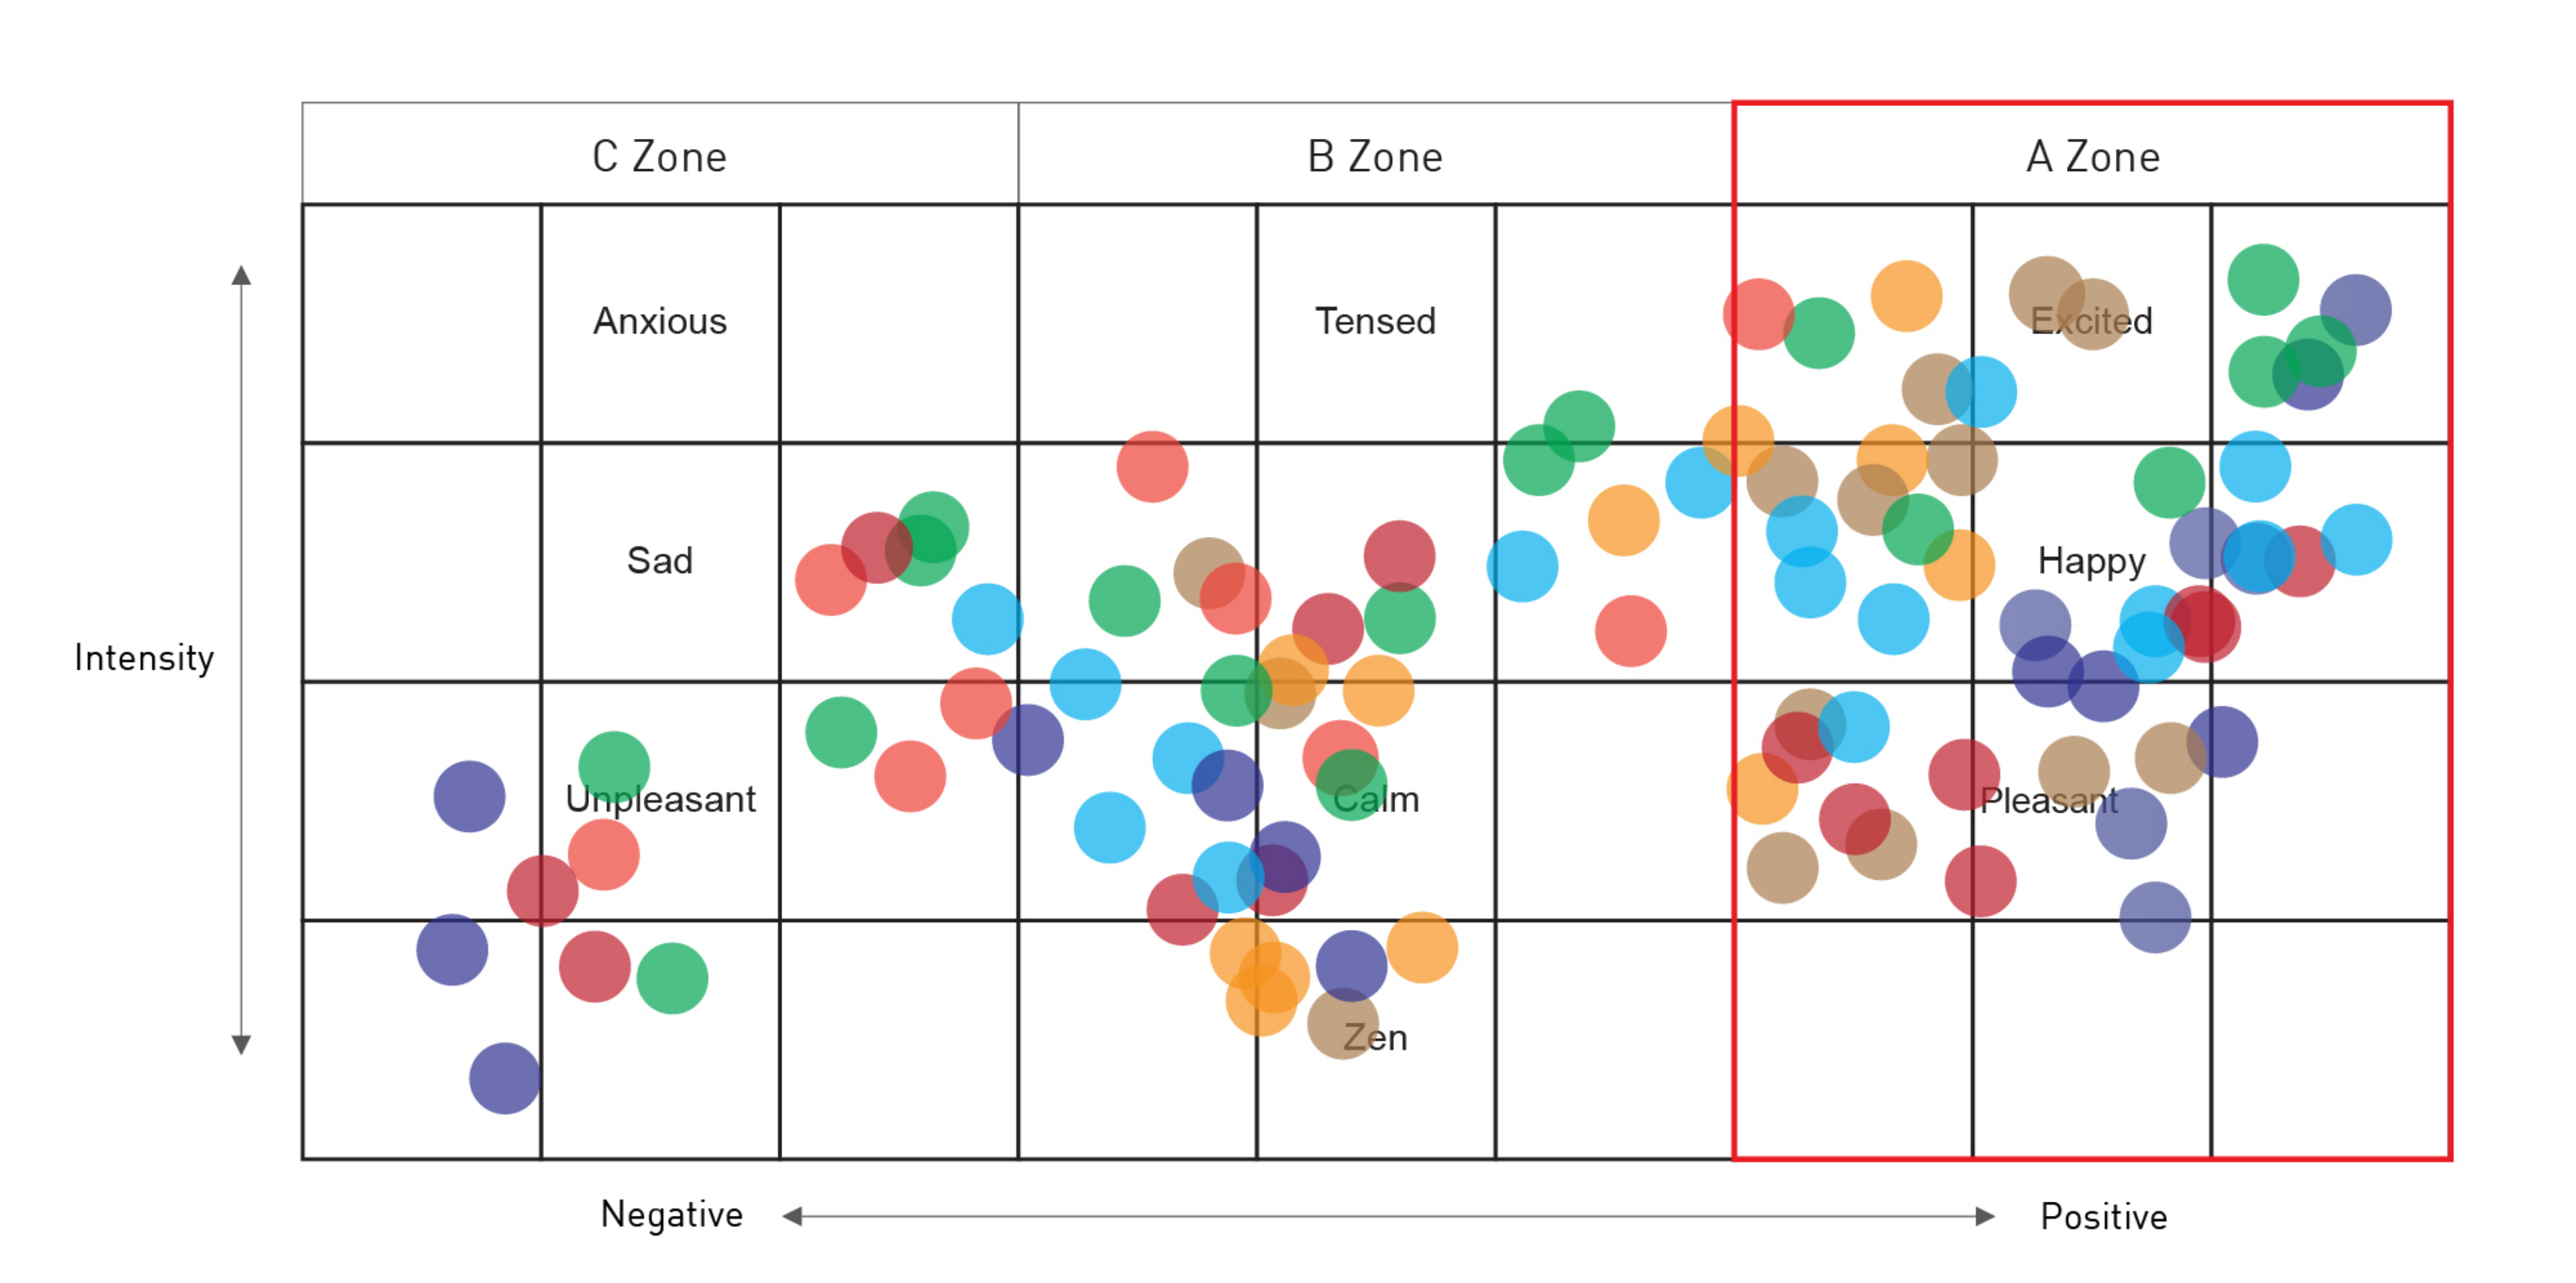
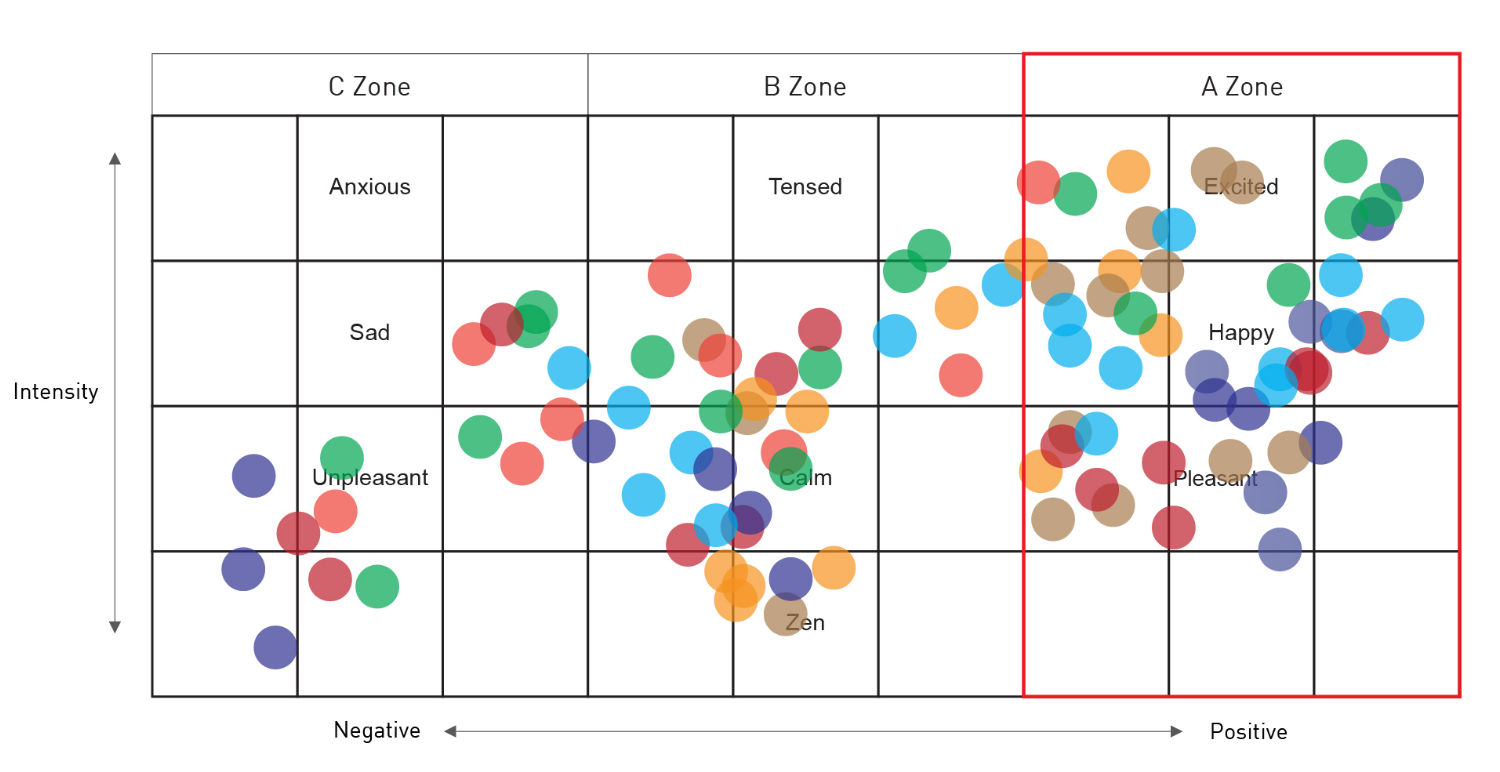
As seen in the graph, each point represents a customer’s actual emotional state, categorized by color. We observed a clear trend: as the experience in the space progressed, visitors’ emotions generally became more positive and intense. Furthermore, a comparison of stress levels before and after entering the space showed a general decrease, indicating an overall positive reaction.
However, we also identified several limitations:
Inconsistent Dwell Time: To accurately compare experiences, dwell time in each zone needed to be similar, but it was difficult to control how long each visitor stayed in one place. This limited the accuracy of the results. Subjective Interpretation: Because the results were not presented as objective numerical values, it was difficult to build trust and satisfaction in the findings. Scalability: It was challenging to measure more than two people at the same time.
The Happy Bath exhibition, which ran for a month starting in September 2025, was based on the concept of “Happy Moments.” Because this exhibition was designed as a single, cohesive experience, analyzing emotions based on the customer journey was simpler than in the multi-zone B.READY test. Our main challenge was deciding how to measure and convey the “happy moments” to the visitors. In the B.READY test, the interpretation relied entirely on Dr. Kwon’s analysis, which wasn’t always intuitive for the participants. Therefore, for this exhibition, we chose to visualize the emotional results using a clear numerical score rather than conveying ambiguous feelings.
We used up to 20 wearable bands to monitor all participants’ emotions in real-time. Based on the emotional data,
we predefined seven “zones” or levels of happiness. The experience was designed to offer different rewards based
on the score achieved. While results varied individually, we were able to observe a wide range of emotional changes
during the ‘Bubble Gazing’ experience, confirming the potential and application methods for this technology in an event setting.
〈Home, p → q〉
Our hypothesis was: If a visitor’s emotional data points fall within “Zone A” at least once during the experience, we define that as a “Happy Moment.” The total number of points in that zone is then converted to a score from 1-7. We also noted that there was no direct correlation between a visitor’s main, conscious emotion and their measured “Happy Moment” score, as people can feel multiple emotions at once.
“We believe this is a new method for measuring and interpreting experience. By designing diverse micro-experiences within a single large space, we can measure the emotional changes that occur and apply that data to understand the entire journey.”
Emotion Measurement
We successfully observed a wide range of emotional changes. However, there was often a discrepancy between the emotions a person self-reported feeling and the emotions measured by the device.
Measurement Design
The technology allows us to provide feedback based on predefined assumptions (e.g., Zone A = Happy). Based on the numerical results, we can propose engaging content, such as offering rewards, to elicit various customer reactions.
Technology & Application
Using up to 20 bands, we could monitor emotions in real-time and use emotional satisfaction as part of the event experience. However, the technology still has limitations in its ability to provide real-time, personalized feedback directly to customers or to track their precise location as they move through a space.